Just setting up an eCommerce store and running Facebook ads for it, doesn’t mean that you will earn a lot of money. Facebook gives a lot of data to analyze the campaigns. But the key is in our hands that we have to perfectly analyze and track the data in order to make the right decisions for a high conversion rate.
To run profitable campaigns on Facebook is mainly to correctly analyze the stats given on the Facebook advertising dashboard.
Not all the metrics are displayed on the Facebook advertising dashboard to analyze. So now the question arises where to find those metrics to analyze the more data.
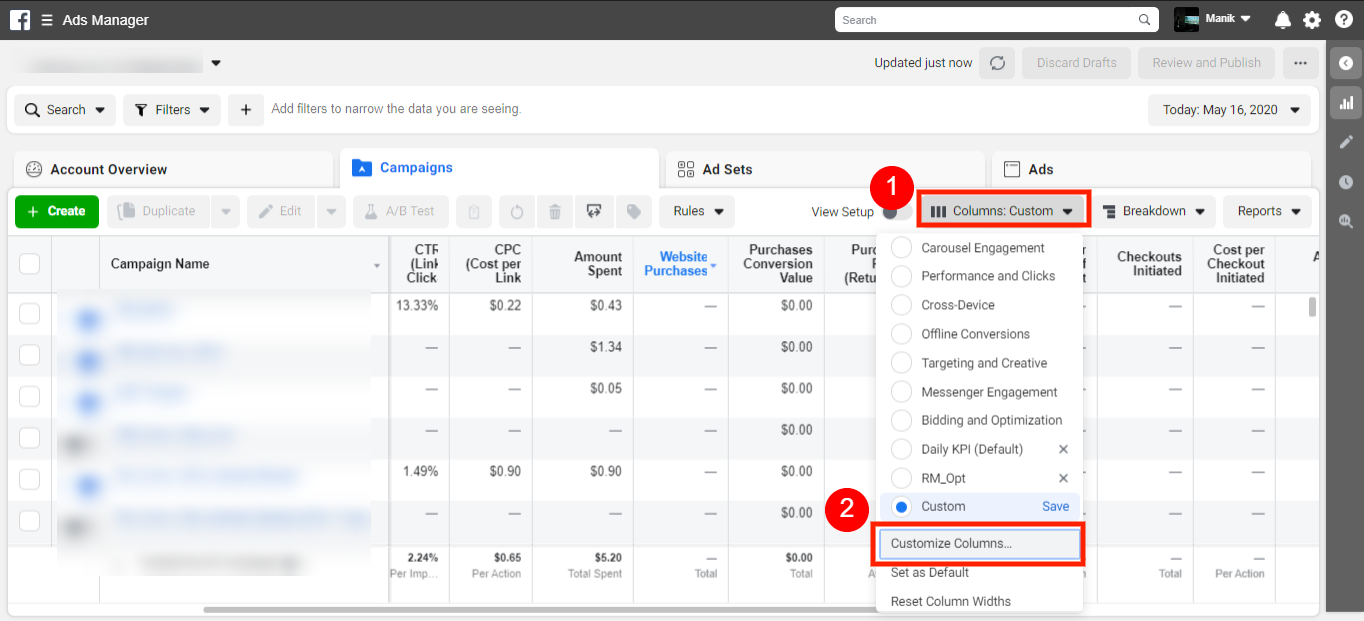
Below are the steps of it:Click on ‘Column: Custom’.
1. Click on the ‘Customize column’.
2. Click on the ‘Customize column’.
3. Enter the name of the metric you want to track/analyze.
4. Check the checkbox(es).
5. Save and give a proper name to the custom metrics. So that in future you will not perform the same step to find these metrics.
6. Click on ‘Apply’.

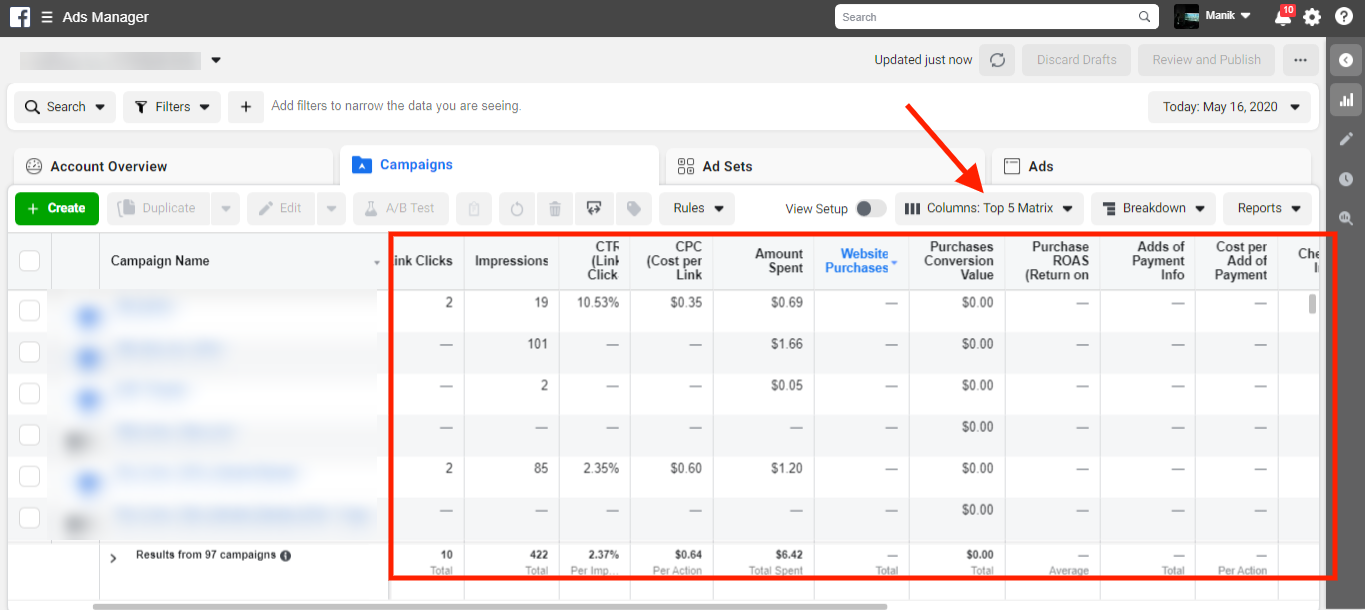
You can see now custom metrics are displaying on the Facebook advertising dashboard.
Let’s talk about which are the top 5 metrics for Facebook Ecommerce Campaigns on which we have to keep an eye on a regular basis.
1. Post Engagement
What is Post Engagement? This defines that, The total number of actions that people take involving your ads. For example, when users are liking your ad, commenting on the ad, sharing the ad, saving the ad, clicking on the ads, etc. These operations come under post engagement. This can only be done if the ads are really attractive, eye-catching, convey a fruitful message, etc.
- This metric itself tells you that the ad(s) you are running is really liked by people or not.
- If the Post Engagement is low then CTR(Click Through Rate) will become low.
- If CTR is low it means fewer clicks on the ads.
- Fewer clicks on ads mean minimum chances of conversion rate.
The clicks on the ads are directly proportional to CTR. The more clicks, the higher is the CTR.
Sometimes people give negative comments on the ads.
Tip: Don’t delete that negative comment just hide the comment. By hiding the negative comment the social engagement will not decrease.

2. Checkouts
If the user likes your product and seems to be like that it is really a problem-solving product they will definitely proceed to add the product into the cart and initiate the checkout process by filing the shipping and billing details. Also, if you are offering them an exciting offer on the affordable price product people will not think twice to buy.
Getting the number of checkouts is not enough until they are under target cost.
Here how you can measure the cost per checkout:
Cost per checkout = ad spent / total of checkout
3. Purchase
This defines the number of purchase events tracked by the pixel on your website and attributed to your ads.
This metric displays the number of purchases resulted from the ads.
Let’s take an example, by looking at the number of purchases occurring today gives you the idea that which ad is performing well ow which is not. But keep in mind don’t make any quick action just only looking at a one-day data. Look on the past stats of purchase(almost 7-10 days), analyze it and then take the suitable action of either to pause the ad or to continue it.
Sometimes this kind of scenario also occurs that is, suppose there are too many checkouts but few purchases or no purchase. there may be some major reasons behind that. Some of them may are:
- Maybe the user is stuck when they trying to increase or decrease the quantity of the product.
- Maybe loading speed from the checkout page to payment info page may be slow.
- Maybe the checkout page is asking for too much customer details which the customers is not willing to fill(link DOB, Occupation, Annual Income etc).
If you feel above points are may affecting the purchase then you can get optimise the website from any expert developer for better performance of the website.

Believe me, if the numbers are good enough in the purchase section at least you can take a calm breath. But the game is not over here. The other main metrics are still pending to review and analyze.
4. Cost per Acquisition (CPA)
Cost per Acquisition (CPA) is sometimes also called cost per purchase. It defines that the average cost of per purchase.
Here how you can measure the CPA:
CPA = ad spent / total of conversions
If you are getting a number of purchases but you can’t celebrate here the success until the cost per purchase is not under control as decided by you.
Obviously, if the CPA is high it clearly states you are in loos but if CPA is low you are in profit.
So firstly, it is important to analyze the CPA at the campaign level which gives the idea of which campaign(s) is performing well.
Then further go into the adset and check which audience is performing well or which is not. Here you may take the further decision to increase the budget of a well-performing audience and on the other hand pause the adset(s)/ which are not performing well to eliminate the wastage of money.
5. ROAS(Return On Advertising Spend)
Return On Advertising Spend, (ROAS), is a marketing metric that measures the performance of a digital advertising campaign. Getting the number of purchases is not good until you get the ROAS as per your expectation.
Suppose we are thinking to spend $100 a day and want to achieve a sale of $500. By this means you are expecting a ROAS of five.
Here how you can measure the ROAS:
Return on Ad Spend (ROAS) = conversion value / ad spent
At the initial stage, you will be doing a lot of testing to find the winning audience and you may get low ROAS. Once will you find the winning audience you may scale to achieve the target ROAS. If the ROAS is high, the more profit you will get. So keeping an eye on ROAS, at last, is very important to make the business highly profitable.
Conclusion:
Analyzing the data is the skill in itself. Obviously, the above matrices are not enough to analyse the campaign performance. There are other important matrices too which we also have to track.
If we talk in short about which are the other important metrics to track, then some of them are Impression, CTR(Click Through Rate), CPC(Cost per Click), CPM(Cost Per Mile / Cost per 1000 Impressions), etc.
However, the above five matrices are the leading matrices which you have to monitor on a regular basis for tracking the e-comm sale from the Facebook ads.


")